|
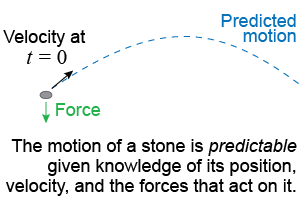
 The quantum behavior of a particle is very different from the motion of a stone tossed in the air. According to classical physics, such as Newton’s laws, if you know the initial velocity and forces you can calculate exactly the path the stone will follow. This kind of universe is deterministic, meaning that the future can be determined from knowledge of the present.
|
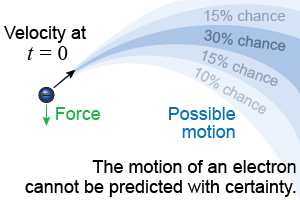
 You cannot make a similar prediction about the future state of a single electron. Even if you knew the electron’s position and velocity at one moment, its future quickly becomes randomized by quantum fluctuations. There might be a 30% chance the electron lies in a certain range of velocities and positions and a 15% chance the electron has a different range of positions and speeds.
|
The core concept of quantum physics is probability. The outcome of a quantum calculation is the probability of a system being in a particular state of position, energy, or momentum. For example, we might calculate a 30% chance that any electron has a certain range of energy in a certain system. We cannot, however, predict whether any one specific electron will have that energy. 
|
Fortunately, we usually don’t care about a single electron! Instead, we are interested in the average behavior of trillions of electrons. Statistics and probability allow very accurate predictions about the average behavior of a collection of particles even though we cannot predict the behavior of any single particle. 
|
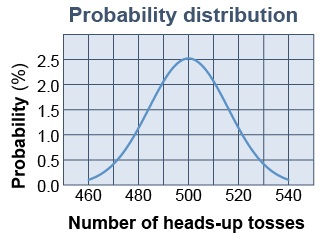
 Consider tossing a coin. The coin may land heads-up or tails-up. The probability of landing heads-up is 50%. If you flip a coin once you cannot predict with any confidence whether it will land heads-up. Nonetheless, knowing the probability is 50% means that you can predict that if you flipped the coin 1,000 times the most likely outcome is 500 heads-up results and that there is an 80% chance that the number of heads-up results is between 480 and 520. The graph at right shows the chance of getting between 460 and 540 heads-up results out of 1,000 tosses. This graph is called a probability distribution because it shows you how the probability of a specific outcome is distributed over all possible outcomes. As with the coin tosses, probability does allow quantitative predictions for a collection of many particles.
|
| |
|

