|

|
When white light passes through a prism the light is dispersed into its individual wavelengths and a spectrum of light is created. For the rainbow produced by the prism, even though the light has different colors, there is a smooth or continuous spectrum of light called a continuum spectrum. 
|
The light produced by energy level transitions of the atom, however, consists of discrete, not continuous, wavelengths. In a line spectrum, each individual wavelength of light corresponding to the emission or absorption of light by the atom is called a spectral line. When the atoms are emitting light, bright lines appear in this emission spectrum. A discharge tube contains a gas that produces an emission spectrum when a voltage is applied across it. When the atoms are along the line of sight toward a background light source they absorb the light to create an absorption spectrum. An absorption spectrum often appears as black lines on an otherwise continuous spectrum of light. These black lines are called absorption lines. 
|
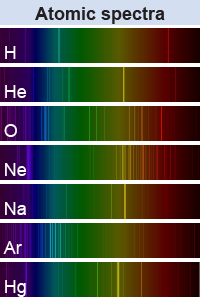
Every element contains a different number of protons and electrons, so the electrical energy between its charged particles will be different. This results in every atom having a unique signature in its line spectrum. Hydrogen can be distinguished from other elements by comparing their line spectra. 
| 
|
An instrument that disperses light into its constituent wavelengths is called a spectrograph. The simplest kind of spectrograph is the prism. Light of any kind—not just white light!—can enter the prism through one side and is dispersed into a spectrum as it exits out the other side. 
|
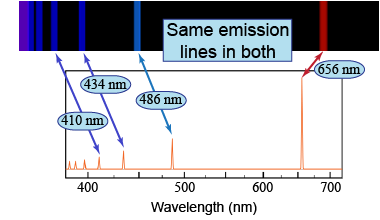
 Emission-line spectra are often represented with a black background and bright, vertical emission lines, such as in the top panel of the figure on the right. Another method of representing the data is through a line plot, as shown in the bottom panel of the figure. Both of these representations show the same emission lines.
|
Real atoms have an infinite number of energy levels. If an atom had only two energy levels, how many lines would appear on its emission spectrum?
 |
Three lines would appear.
Recall that an atom emits energy when an electron transitions from a higher energy state to a lower energy state. In this case only three transitions can be made (each of which emits a photon):
n = 2 → n = 1
n = ∞ → n = 1
n = ∞ → n = 2 n = ∞ means that the electron was initially unbound to the atom. 
|

