|
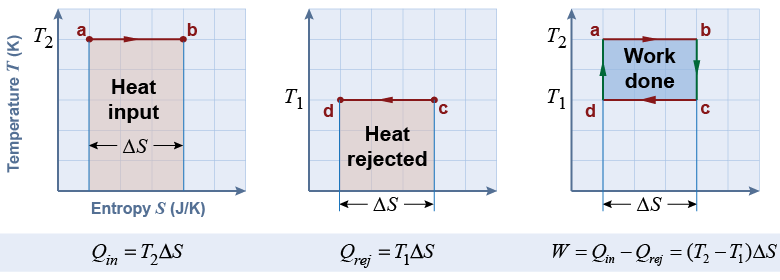
The temperature−entropy (TS) graph allows us to analyze the efficiency of the Carnot cycle. Consider the graph drawn with absolute zero as the lower limit of the temperature axis. With this choice of scale, the heat added to the engine is equal to the pink shaded area on the left-hand graph. The heat rejected by the engine is the pink shaded area in the middle graph. The heat that is converted to work is the blue shaded area on the right-hand graph, which is the intersection of the other two. 
|

|
The efficiency of the Carnot cycle is the work output divided by the heat input:
Notice that the change in entropy, ΔS, cancels out because it appears in both the numerator and denominator. We can rearrange the remaining equation into a very useful form that depends only on the highest and lowest temperatures. For a Carnot engine operating between temperatures T1 and T2, the Carnot efficiency is given by equation (25.4) below. This is the highest theoretically possible efficiency for any heat engine that converts heat into work. 
|
| (25.4) | | | T1 | = | lower temperature (K) | | T2 | = | higher temperature (K) |
| Carnot
efficiency
|
|
No heat engine that operates above absolute zero can be 100% efficient because some heat is rejected along path c → d in the thermodynamic cycle. Equation (25.4) tells us that the highest efficiency occurs when the engine operates between the largest difference in temperatures. A typical car engine reaches a maximum combustion temperature of around 2,500 K (4,000ºF). The exhaust temperature is 1,100 K (1,500ºF). The Carnot efficiency for an ideal heat engine operating between these two temperatures is 56%. A modern internal combustion engine has an operating thermal efficiency that ranges from about 20% for a production car up to 34% for a highly tuned race engine. 
|
| |
|

