|
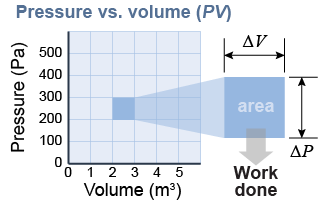
 Since pressure and volume change constantly, we use a graph to determine the work done by the expanding gas pushing on the piston. The pressure versus volume graph, or PV diagram, has pressure on the vertical axis and volume on the horizontal axis. On this graph, area equals work. If the pressure scale is in newtons per meter squared and the volume scale is in cubic meters, then area has units of joules.
|

|
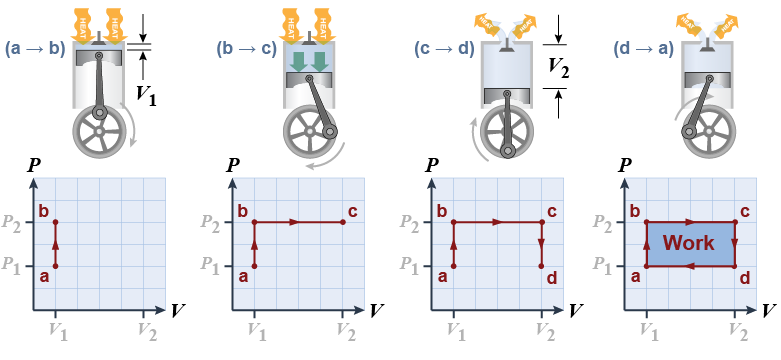
Suppose we could create a heat engine in which the pressure and volume change like the diagram above. How much work is done? How much heat is added? How efficient is the engine at converting heat into work? - At point (a) the volume is at a minimum. From (a) to (b) heat is applied to the engine and the pressure of the gas rises.
- From (b) to (c) the gas expands, doing work on the piston. In this (unrealistic) example we continue to add enough heat to keep pressure constant as the gas expands.
- From (c) to (d) the valve opens and reduces the pressure back to its starting point. Heat flows out of the engine into the surroundings.
- From (d) to (a) the piston moves back up.

|
The work done by the expanding gas on the piston in one cycle is the area enclosed by the curve abcd. In terms of pressure and volume, the area enclosed by one cycle on the graph is (P2 − P1)(V2 − V1). The important result here is that the area enclosed by the cycle on a PV diagram equals the work done by the gas in one cycle. 
|
The gas in a thermodynamic cycle returns to its original pressure and volume at the end of a complete cycle. This means that the net energy change of the gas over a full cycle is zero! If the change in energy is zero, then by the first law of thermodynamics the work done by the gas must equal the heat input, or Q = PΔV. 
 |
The only way the energy could change is for the temperature to be different. If the mass is the same, however, the temperature cannot be different because of the ideal gas law PV = nRT. If PV/nR is the same at the beginning and at the end of a cycle, then T must also be the same. 
|

