|
Consider a thought experiment in which 10,000 moving particles are placed in a box. At the start, half the particles are moving 100 m/s to the right and half are moving at the same speed to the left. The total kinetic energy is E. Collisions between particles are perfectly elastic, which means that any energy lost by one particle in a collision is gained by the other. The total kinetic energy of all the particles therefore stays constant over time. What happens to the particle velocities over time? 
|

|
Over time, particle velocities become scattered in all directions by collisions. Eventually, an equilibrium is reached in which, on average, equal numbers of particles are moving in all directions with different speeds. A bar graph of particle speeds shows a characteristic shape with few particles at very high or very low speeds and a single maximum. This graph is called a distribution function because it shows how particle speeds are distributed over the whole population of particles. 
|
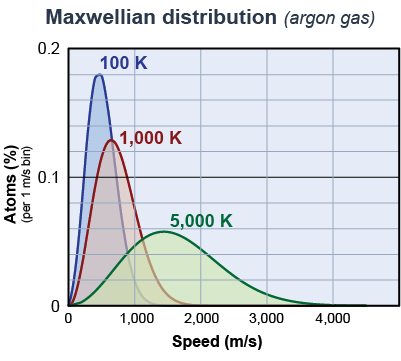
 In 1860, the Scottish physicist James Clerk Maxwell used statistical mechanics to calculate the speeds in a gas of interacting particles. The Maxwellian distribution predicts the percentage of particles at each speed as a function of the temperature. The graph on the right shows the Maxwellian distribution of speeds at 100 K, 1000 K, and 5,000 K. The total area under each curve is the same—100%. That means that 100% of the particles have speeds that fit the curve for any given temperature.
|
- At any temperature above absolute zero there will be a range of particle speeds.
There are some particles with very low speeds and some with very high speeds at all temperatures. - As the temperature increases, the average speed increases.
- The width of the distribution of speeds also increases with temperature.

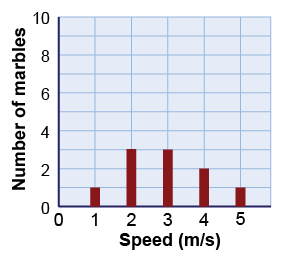
 What is the mean speed of a group of 10 marbles that have the distribution of speeds shown in the graph on the right?
 - 1.5 m/s
- 2.9 m/s
- 3.0 m/s
- 3.1 m/s
 |
The correct answer is b, 2.9 m/s. Add up the speeds of each marble and divide by the total number of marbles, which is 10. To perform the addition, you multiply the number of marbles by their speeds: To get the average speed divide the total by 10 marbles: vavg = 29 m/s ÷ 10 = 2.9 m/s 
| |
| |
|

