|
| Essential questions | | What is the acceleration for motion down an inclined plane?
What are the graphs for motion down an inclined plane? | |
|
Galileo Galilei used inclined planes for his quantitative experiments into the nature of position, time, and acceleration. Galileo took advantage of the property that objects roll faster down steeper ramps than down shallower ramps. In this investigation, you will use the slope of a velocity versus time graph to determine how acceleration varies with the inclination of a ramp. 
|
Part 1: Acceleration down a ramp

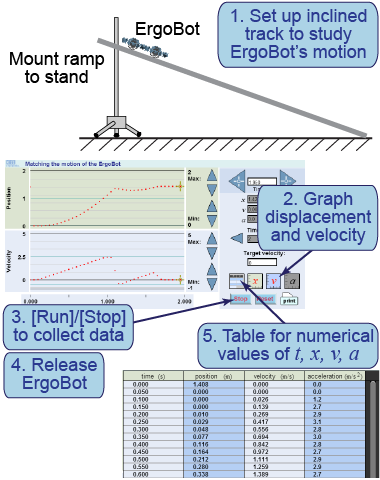
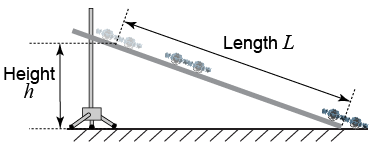
- Set up the track to act as an inclined plane with a height around 25 cm and put the ErgoBot in “freewheel” mode.
- Launch the electronic tool and set it to graph displacement and velocity.
- After pairing the ErgoBot with your computer, press [Run] to begin collecting data.
- Release the ErgoBot down the track.
- Access your data using the table button. Create position–time and velocity–time graphs of your data.
- Fit your graphs using different values of acceleration and initial time (the time you actually let go of the ErgoBot). Record and plot the parameters of your best fit.
- What is the equation you are fitting to the position versus time graph? The velocity versus time graph?
- Explain the connection between the velocity versus time graph and the acceleration.

|
|
In this interactive element, you will capture real-time data from the motion of the ErgoBot and display the data as position versus time, velocity versus time, and/or acceleration versus time graphs.
|
Part 2: How does acceleration vary with the ramp’s inclination?

- Measure the height h and length L of the ramp.
- Record data and release the ErgoBot.
- Use the resulting graphs to measure the acceleration a of the ErgoBot down the inclined plane.
- Repeat for a total of five different values of h, measuring a in each case. Tabulate your results.
- In your table, also calculate the values of (h/L) and (aL)/h.
- Draw a graph with a on the vertical axis against h on the horizontal axis. Draw a line through your data points to show the trend.
- How does the acceleration vary as the slope of the ramp increases?
- What is the value of the slope of the line through your data? (Remember to include units!)
- Do any columns in your table remind you of a physical constant? Explain.
- Prepare a written report for your investigation (Parts 1 and 2). In addition to addressing the above questions, describe the procedure, results, and conclusion or interpretation of your investigation.

|

