| | Essential questions | | What is the acceleration for motion down an inclined plane?
What are the graphs for motion down an inclined plane? | |
|
Graphs of position versus time and velocity versus time show the nature of the motion of an object, such as a block sliding down a frictionless ramp. Unaccelerated motion (i.e., with constant velocity) will have one set of shapes for those graphs, whereas accelerated motion will show different graphical relationships. Physicists often use properties of a graph to measure fundamental physical quantities. In this investigation you will answer this question: How can you use motion down a ramp graphically to measure the acceleration due to gravity g? 
|
Part 1: Position–time and velocity–time graphs

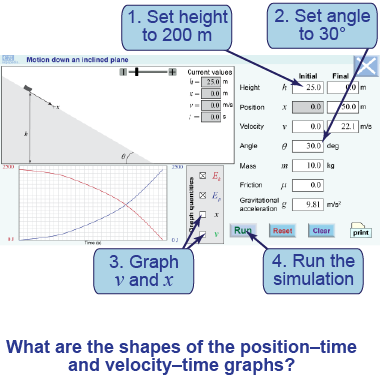
- Set the initial height h0 to 200 m.
- Set the inclination angle θ to 30°.
- Check the boxes to graph both position and velocity versus time.
- Run the simulation.
- Describe the shapes of the position–time and velocity–time graphs.
- Using the equations of motion, explain why each graph has that shape.

|
|
In this interactive simulation, you will study motion along an inclined plane. The block slides faster or slower down the plane depending on its steepness. You can plot the position and/or velocity as a function of time in a rotated reference frame along the plane.
|
Part 2: Measuring the acceleration due to gravity
- Devise a procedure to measure g using the simulation, a table, a graph, and a = (h/x)g.
- Your procedure should use at least five different values of θ.
- Your procedure should include graphing your data, drawing a trend line through the data points, measuring the slope of the line, and using that slope as part of calculating g.
- For your written report, write down your procedure, noting the steps required for collecting data, graphing data, making calculations, and arriving at the answer.
- What is the value of the slope of a line through your data? (Remember to include units!)
- What is the physical meaning of the graph’s slope? Use velocity, time, and acceleration in your answer.
- In your written report, note your conclusion for the value of the acceleration due to gravity and explain any discrepancies from the commonly accepted value.

|
| |
|

