- A particular service station in Canada sells gasoline for $0.85 per liter. If your tank holds 14 gallons, then what is the cost to fill up?
- Which is longer, 100 miles or 150,000 meters?
- The summit of Mount Everest at 8,848 m is the highest point on the Earth’s surface. If a small airplane can fly no higher than 30,000 ft, can it fly directly over the summit of Mt. Everest?
- Convert the time 3:24:22 to seconds.
- Convert 55 miles per hour into meters per second.
- One cubic yard is equal to how many cubic feet?
- On your 50th birthday, how many seconds have you lived?
- What is the volume of a steel marble that has a mass of 50 g? (The density of steel is 7,800 kg/m3.)
- Which is longer, 10 million seconds or 100 days?
 How long is a 5 mile road in centimeters? How long is a 5 mile road in centimeters?
 One mil is 0.001 inch. How many millimeters is one mil? One mil is 0.001 inch. How many millimeters is one mil?
 One acre is 43,560 square feet. (There are 5,280 feet in a mile and 3.28 feet in a meter.) One acre is 43,560 square feet. (There are 5,280 feet in a mile and 3.28 feet in a meter.)
- How many square miles is one acre?
- How many square meters is one acre?
- How many square kilometers is one acre?
 Convert 1,500 revolutions per minute (rpm) into revolutions per second. Convert 1,500 revolutions per minute (rpm) into revolutions per second.

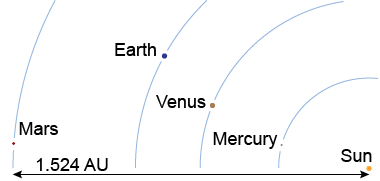
 The average orbital radius of Mars is 1.524 astronomical units (AU). One astronomical unit is the radius of the Earth’s orbit, or 1.5×10¹¹ m. What is the orbital radius of Mars in kilometers? The average orbital radius of Mars is 1.524 astronomical units (AU). One astronomical unit is the radius of the Earth’s orbit, or 1.5×10¹¹ m. What is the orbital radius of Mars in kilometers?
| | 
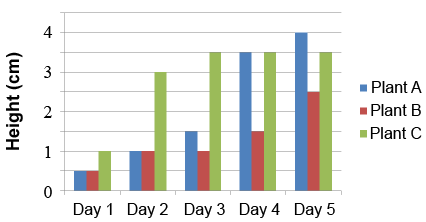
 Measurements were made of the heights of three different plants over five days. The data collected are displayed in the chart above. Measurements were made of the heights of three different plants over five days. The data collected are displayed in the chart above.
- Which plant grew the most over the five days the plants were measured?
- Which plant grew the most between day 1 and day 2?
- How could you infer those conclusions using the bar chart?
- Generate a new bar chart that plots the change in the height of each plant between days, i.e., between days 1 and 2, 2 and 3, 3 and 4, and 4 and 5.
- Which plant grew the most on any single day?
- A bar chart may not be the best way to represent these data. What kind of graph or chart would you use to plot the height of these plants? Explain.
 Convert 293 cubic feet per hour into liters per second. Convert 293 cubic feet per hour into liters per second.
 Refer to the table to answer the following questions. Refer to the table to answer the following questions.
Position x
(m) | Speed v
(m/s) |
|---|
| 0.0 | 4.0 | | 5.0 | 3.0 | | 10.0 | 2.0 | | 15.0 | 1.0 | | 20.0 | 0.0 |
- Graph position and speed using speed as the dependent variable.
- Draw a trend line through the data points. What is the slope of your graph? Be sure to use the correct units in your answer.
- Use the graph to estimate the position when the speed is 2.5 m/s.
- Write an equation that is a model to represent the data.
- Use your graph to estimate the speed when the position is 6.8 m.
- Use the equation to estimate the speed when the position is 6.8 m.
- What is the range of values of the dependent variable?
|

