|
In physics, a model is a relationship between variables that allows you to predict something unknown based on things that are known. For example, a model of motion allows you to predict the speed of a falling object from the height it has fallen. A graph is a simple form of model that relates two variables, such as speed and height. An equation, or formula, can be another form of model. Complex models can include many equations, computer spreadsheets, and the results of other models. Computer simulations of Earth’s climate are a good example of this kind of model. Making models is important to science and engineering. A model allows us to evaluate how changes in one variable affect the others. 
|
An equation connects variables through the equals sign (=). An equation such as v = d / t means that the speed v is the same as the distance d divided by the time t for all possible values of v, d, and t. Not only are the values the same, but the units are also the same on the left and right sides of the equals sign. Distance divided by time therefore has the units of speed. 
| 
 |
The equation v = d / t is actually a definition of the variable v in terms of fundamental quantities of length and time. Notice how, in this case, the quantities that can be measured directly—distance and time—are used to define speed, a derived quantity. 
|
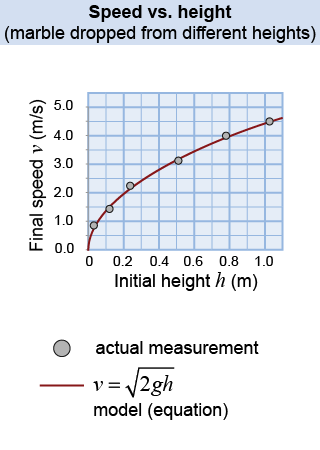
Some equations, such as v = d / t, define one variable in terms of others. Other equations are models that describe relationships among variables. These kinds of equation models are only useful if they also represent reality. The diagram on the right shows how an energy conservation model for the speed of a falling object compares with actual speed measurements made for a falling marble. The model used describes speed as v = √ 2gh . 
|

|
If the data on a graph indicate no relationship between the two plotted variables, this produces a scatter plot. If there is a relationship, however, then a graph will show a pattern represented by that relationship. Some kinds of mathematical relationships are linear (such as y = mx + b) or inverse (y = 1/x). There are also more general kinds of nonlinear relationships, such as a parabola (y = ax2). In the graphs above, the data are plotted as points while the model—represented from these linear and nonlinear equations—are plotted as lines or curves. 
|
Using the equation v = d / t, if you hold d constant and graph v versus t, what kind of relationship will you get? - scatter plot
- linear
- inverse
- nonlinear
 |
The correct answer is c, inverse. Essentially, what you are graphing here is v ∝ 1/t, which is an inverse relation. As the time taken to cover a distance gets shorter, the velocity increases. 
|
| |
|

