|
Quantities only have meaning if you know what units they are expressed in. For example, 22 does not tell you how much mass there is, but 22 kg does. Humans have invented many different units that are convenient for different applications. Conversion factors, such as 1 m = 3.28 ft, allow you to translate a quantity into a different set of units. Scientific notation is a convenient way of writing very large and very small numbers as a product of a base multiplied by a power of 10, such as 1.5×10³. Many areas of physics involve data, which are measurements of one or more variables. A graph is a pictorial way of visualizing data to more easily recognize or demonstrate relationships among variables. Solving physics problems requires systematic thinking. Start by identifying what is asked and what information is given. The next step is to identify any known relationships that involve what is asked and/or given. Finally, the information and the relationships are used to solve the problem. The solution process often requires algebra. Algebra provides the mathematical and logical rules for combining and rearranging equations and variables while preserving both equality and underlying relationships. 
|
|
conversion factor, dependent variable, independent variable, variable, model
|
Review problems and questions |
|
- Arrange the following lengths from largest to smallest.
(a) 632 mm; (b) 35 in; (c) 1.1 m; (d) 2 ft 
 |
Answer: c, b, a, d
Convert all of them to the same units (meters) and then list them from largest to smallest: 
|
- Arrange the following times from largest to smallest.
(a) 1,500 s; (b) 500 min; (c) 2 hr; (d) 0.01 day 
 |
Answer: b, c, a, d
Convert all of them to seconds and list them from largest to smallest: 
|

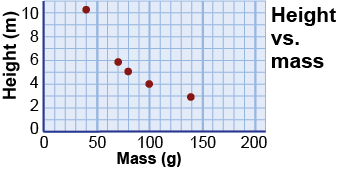
- The graph shows the data for an experiment that used a rubber band to launch small model rockets of different masses straight up. The rubber band was stretched the same amount for each rocket. Answer the following questions based on the graph.
- What is the independent variable in this experiment and what is its range of values?
- What is the dependent variable in this experiment and what is its range of values?
- Does the relationship between height and mass appear directly or inversely proportional?
- How high would you expect a rocket of 120 g to fly?
- Suppose you observe a height of 7 m. Estimate the mass of the rocket.


|
- Mass is the independent variable. (For each mass of rocket the experimenter measured the height it reached.) Its range of values is from 40 to 140 g.
- Height is the dependent variable. Its range of values is from 3 to 10.2 m.
- The relationship appears to be inverse, i.e., that height decreases as mass increases.
- Approximately 3.5 m
- Approximately 55 g

|
- Which two of the following statements are not true?
- 2x + y = 2(x + y)
- z(x − y) = (x − y)z
- z(x − y) = zx − yz
- xyz = (xy)(yz)


|
(a) is not true, because 2(x + y) = 2x + 2y, not 2x + y.
(d) is not true, because (xy)(yz) = xy2z, not xyz. 
|
Take a Quiz |

