|
| Essential questions | | How does acceleration appear on motion graphs? | |
|
The equation that relates an object’s position to its velocity and acceleration is a useful model for one-dimensional motion. The model can be used to predict position versus time and velocity versus time graphs. Both graphs are essential ways to look at accelerated motion. 
|
Part 1: Modeling accelerated motion

- The interactive, graphical model shows position and velocity versus time graphs. Red circles on the position versus time graph are “targets.” Your goal is to adjust initial velocity (v0) and acceleration (a) so that the curve hits both targets.
- [SIM] starts the simulation. [Stop] stops it without changing values. [Clear] resets all variables to zero. [Reset] resets all variables and sets new targets.
- Enter values in the white boxes. The top score of 100 is achieved by hitting the center of each target.
- Describe the meaning of v0 and a.
- How would the ability to set the initial position (x0) affect the difficulty of getting a perfect score?
- Describe the position versus time graph when acceleration is positive. Describe the velocity graph.
- Describe the position versus time graph when acceleration is negative. Describe the velocity graph.
|
|
In this interactive simulation, you will create a model for the motion of the ErgoBot by adjusting the values of the initial velocity and acceleration. The goal is to cause the ErgoBot’s motion to pass through the target circles on the position versus time graph. Press [Run] to upload your solution to the ErgoBot and see it demonstrate the motion on the floor of your classroom.
|
Part 2: A multistep model

- The second model allows you to change the acceleration 5 s into the motion, halfway through.
- In this model, unlike the first, you can set the starting position (x0) in addition to the initial velocity.
- Try to hit the centers of the three red target circles.
- Why can you not set the position or velocity when the cart begins the second half of its motion?
- How would not being able to set the initial position, like in the first model, affect the difficulty of getting a perfect score?
|
|
In this interactive simulation, you will create a model for the motion of the ErgoBot by adjusting the values of the initial velocity, initial position, and two periods of acceleration. The goal is to cause the plotted curve of the ErgoBot’s motion to pass through the target circles on the position versus time graph.
|
| The timer utility in the center panel of this interactive tool can be used to generate a sound every 1.0 seconds—or any time interval of your choosing (down to 0.3 s). This may be used in this lesson for a class demonstration or activity. | 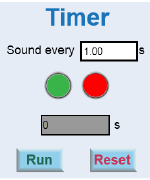 |
|


