|
| Essential questions | | What is acceleration?
What is the relationship among acceleration, speed, and velocity? | |
|
A car rolling down a ramp accelerates. A car given an initial velocity up a ramp accelerates at the same rate! The ErgoBot allows us to quantitatively investigate acceleration and its relationship to speed and velocity. 
|
Part 1: Acceleration down a ramp

- Launch the interactive tool [below] and set it to graph velocity and acceleration.
- Set up the track at a low angle. Put the bumper at the bottom to catch the ErgoBot.
- Hold the ErgoBot at the top of the ramp. Press [Run]. Once data begin to show, release the ErgoBot.
- Observe the graphs of its motion. Press [Stop].
- Calculate acceleration in meters per second squared from the slope of the velocity graph.
- What is the elapsed time from the moment you release the ErgoBot until it reaches the bottom?
- Calculate the expected final velocity using the acceleration from Part a and the time from Part b.
- How close is the measured final velocity to the prediction? Include a percentage error.
- Change the ramp angle and run the experiment again. Explain in one sentence the effect of increasing the angle on the acceleration of the ErgoBot.
- How can you infer changes in acceleration from the ErgoBot’s velocity versus time graph?
|
|
In this interactive element, you will capture real-time data from the motion of the ErgoBot and display the data as position versus time, velocity versus time, and/or acceleration versus time graphs.
|
| Use this graphing tool to measure the slope of the velocity versus time graph from the ErgoBot. First, collect your real-time data with the ErgoBot using the interactive element above. Second, press the button to save your data to local storage. You can now close the ErgoBot application. | 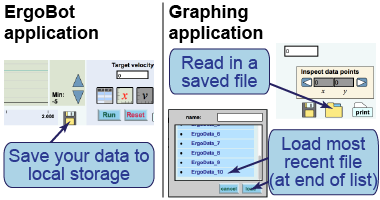 | Now open the graphing application. Press the button to read the data into the graphing utility; the most recent data file is listed at the bottom. You can now plot velocity versus time. You will have to change the ranges of the axes to see the data easily. Finally, fit a line to the velocity versus time graph and use the parameters of the line to calculate the acceleration of the ErgoBot.
|
Part 2: Comparing acceleration up and down a ramp

- Reset the ramp to its original angle. Set the ErgoBot at the bottom of the track, still facing down the ramp, and reset the origin.
- Give the ErgoBot a push so it rolls up the track and back down again.
- Observe the position and velocity graphs during a complete round trip.
- Launch the ErgoBot “ticker tape” chart application. Generate a ticker tape chart as the ErgoBot rolls down the ramp.
- Describe the velocity during the motion. Does the velocity change sign?
- At what point in the motion is the velocity zero? How is this shown graphically?
- Describe the acceleration during the motion. Does the acceleration change sign?
- Calculate the acceleration in meters per second squared from the slope of the velocity graph.
- Compare the acceleration from Part 2 to the acceleration you calculated in Part 1. Do the accelerations have the same magnitude? The same sign? Explain.
- On your ticker tape chart, label where the velocity is close to zero and where it is at its maximum.
- Which ticker tape chart (above right) corresponds to acceleration down a ramp? What properties of the chart allow you to make this inference?
- How can you calculate acceleration from this chart if the dots are made in 0.1 s intervals?
|
|
Use this interactive tool to observe the motion of the ErgoBot in “ticker tape chart” mode. A dot is plotted every 0.1 s showing the position of the ErgoBot. Move the ErgoBot faster and slower and observe how the chart changes.
|


