|
The last step in building a model for motion is to develop a single equation that relates position, velocity, time, and acceleration. Consider a moving object with initial velocity v0 that undergoes constant acceleration. At time t, the velocity has increased from v0 to v. The distance the object travels between time t = 0 and time t is the area shaded on the graph. 
|

|
The v vs. t graph breaks down into two shapes. The area of a triangle is ½ base × height. For triangle A this is ½(v – v0)t. We also know that the change in velocity is acceleration × time, so v – v0 = at. Therefore, the area of triangle A is ½at2. The area of rectangle B is v0t. Area on a v vs. t graph equals distance, and adding the triangle to the rectangle gives us this result 
|
One last step remains. The distance traveled is d = x – x0. Substituting this expression yields equation (4.3), which relates position x at any time t to initial position x0, initial velocity v0, and acceleration a. 
|
| (4.3) | | | x | = | position (m) | | x0 | = | initial position (m) | | v0 | = | initial speed (m/s) | | a | = | acceleration (m/s2) | | t | = | time (s) |
| Position
accelerated motion |
|
Equation (4.3) has three terms on the right-hand side, and each term has its own meaning. The first term is the initial position. The second term is the change in position the object would have had if it continued at constant initial speed v0. The third term is the additional change in position resulting from changes in speed that come from acceleration. Note that, if the acceleration is zero, we get back x = x0 + vt, the equation for constant velocity from the last chapter! 
|

 |
A velocity versus time graph is related to acceleration through equation (4.2): This equation is valid for constant acceleration and corresponds to a straight line graph. The slope of the velocity versus time graph is the acceleration and the intercept is the initial velocity v0. Now let’s use this information to solve a graphing problem.
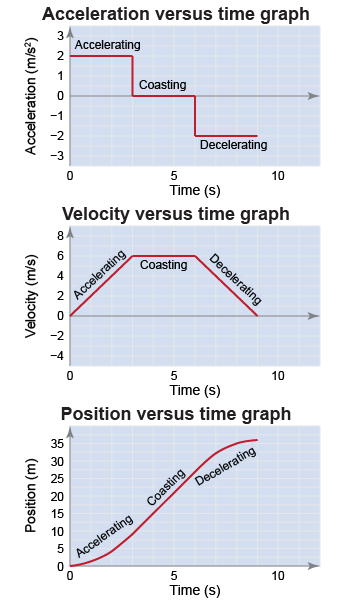
An elevator starts from rest, accelerates at 2 m/s for 3 s, coasts with constant speed for the next 3 s, and then decelerates at −2 m/s for 3 s. Sketch the corresponding acceleration, velocity, and position versus time graphs. | Asked: | time t | | Given: | a = +2 m/s for 3 s,
a = 0 m/s for 3 s, and
a = −2 m/s for 3 s;
initial velocity v0 = 0 m/s | | Relationships: | Velocity and acceleration: v = v0 + at Position and acceleration: d = v0t + ½at2 | | Solution: | Velocity versus time graph:
For the first three seconds, the initial velocity is zero and the acceleration is −2 m/s2. The final velocity is therefore 6 m/s. For the next three seconds, the velocity is constant at this same 6 m/s. For the final three seconds, the initial velocity is 6 m/s and the acceleration is −2 m/s2, leading to a final velocity of 0 m/s2.
Position versus time graph:
For the first three seconds the motion is accelerated, so the position versus time graph is a parabola. The distance covered in those three seconds is ½(2 m/s2)(3 s)2 = 9 m. For the next three seconds, the velocity is constant so the distance traveled is (6 m/s)(3 s) = 18 m. For the final three seconds, the motion is decelerated, so the position versus time graph is a downward facing parabola, again covering 9 m. | |  |

|
A baseball is thrown straight upward and returns to the point from which it was thrown after 5.0 s. Find the baseball’s original speed. The acceleration of the baseball is 9.8 m/s2 downward. - 49 m/s
- 4.9 m/s
- 123 m/s
- 25 m/s
 |
The correct answer is d. We use the equation We do not care about the ball’s position as it returns to its original place after its flight is complete. Therefore we can set x and x0 equal to zero, then plug in the remaining values into our equation and solve for v0: The speed v0 = 24.5 m/s rounds to 25 m/s (two significant figures). 
|
| |
|

