| | Essential questions | | How does sound carry information, such as words? | |
|
The identity of a song, the meaning of words, and even a person’s identity are information that we immediately decode from sound. Sound carries an extraordinary amount of information through the interference of many thousands of frequencies, each of which varies in phase and amplitude over time. 
|
Part 1: Multifrequency sound and the spectrum

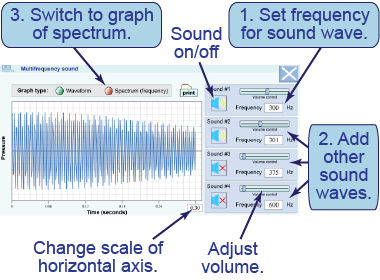
- The electronic resource shows a waveform graph (by default). Set a frequency of 300 Hz and adjust the volume. Set the time axis to display 0.02 s.
- Add a 400 Hz sound, then a 450 Hz sound. Listen to the frequencies separately and together and observe the waveform.
- Switch the graph to display a spectrum—a bar chart that shows the frequencies of the sound. Set the same three frequencies as before and observe the spectrum as you change the frequency and volume.
- Starting with 300 Hz, use three frequencies in the ratios 1:3:5 to create the best approximation to a square wave.
- Can you hear individual frequencies or do you only hear a mixture? What evidence supports your conclusion?
- Compare the time and frequency graphs. Which best describes the frequency content of sound? Which describes the motion of your eardrum?
- Research how many different and distinct frequencies the human ear can simultaneously perceive.

|
In this interactive sound generator, you can create up to three sound tones that will sound at the same time. You can also see a graph of the composite waveform. You can display the sound visually either as the waveform or as a spectrum.
|
Part 2: Real-time sound analysis
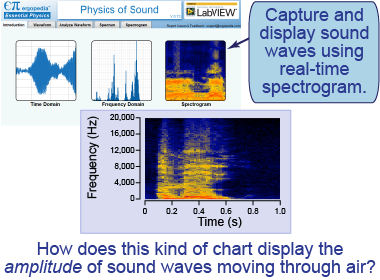
 The Physics of Sound virtual instrument provides a way to capture and analyze sound waves as they move through air. The tool generates a real-time spectrogram that uses color to represent intensity at every location in the chart.
 - Use the spectrogram tool to capture and display your human voice as you speak near your computer’s microphone. Modulate your voice and watch how the frequency and amplitude vary.
- Repeat for various musical and nonmusical sounds.
- What characteristics make musical sounds different from other sounds?
- Describe how the spectrogram represents the three variables of time, frequency, and amplitude.
- Interpret and compare the charts you generated for the frequencies present in a voice to the three frequencies you combined in Part 1. Are there more or fewer frequencies present in the voice?
- Propose an explanation for how sound carries the information in words and music based on your observations of the spectrogram.

|
This part of the investigation requires running the “Physics of Sound” application that you used previously in Investigation 15C. Follow this link for instructions on installing and running the application under either Mac OS X or Windows OS.
|
Piano sounds
The audio attached to this paragraph will play four beeps one second apart followed by a piano selection. 
|
Applause sounds
The audio attached to this paragraph will play four beeps one second apart followed by the sound of applause after a performance. 
|
The sound of beach waves
The audio attached to this paragraph will play four beeps one second apart followed by the sound of waves at a beach. 
|
Classical guitar sounds
The audio attached to this paragraph will play four beeps one second apart followed by a short classical guitar solo. 
|
Crash sounds
The audio attached to this paragraph will play four beeps one second apart followed by the sound of stuff crashing to the ground. 
| | |
| |
|

