|
The true richness of sound and the ability to carry information lie in the fact that many frequencies are present simultaneously. The human ear can “listen” to more than 15,000 different frequencies of sound, forming a sonic image many times per second. The incredible information density in sound comes from the changing patterns of frequency and amplitude for thousands of different frequencies. 
|
Visualizing sound waves
|
Sound waves oscillate much faster than water waves, and air is transparent, so variations in pressure are invisible. To visualize a sound wave scientists and engineers use several different kinds of graphs. The first shows the waveform, which describes how the pressure changes with time. To see the individual oscillations of a sound wave, the time axis must be enlarged to show a value much less than one second. The graph below shows 12.5 cycles in 0.03 s, so the frequency of the wave is This is the musical note G# near the middle of the piano keyboard. 
|

|
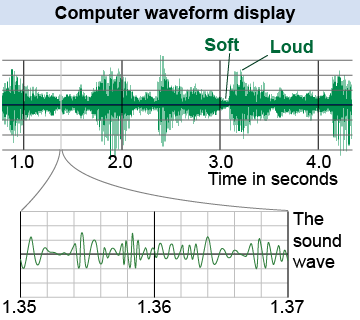
 You may have seen a computer represent a sound as in the diagram on the right. This shows the pressure variation over real time in seconds and minutes. This graph shows the loud and soft variations of amplitude, but to see the individual oscillations of the sound waves, you have to zoom in on the time axis. The lower diagram shows part of the same sound magnified by a factor of 140 in time. The oscillations are now visible on the magnified time scale of 0.01 s per major division of the horizontal axis.
|
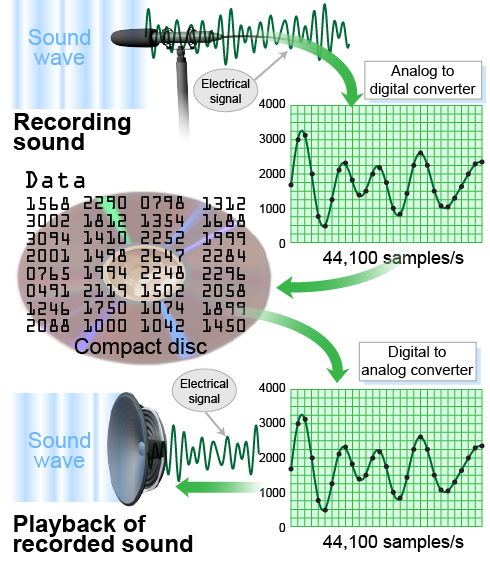
To record a sound wave, the pressure variation in the air is first converted into an electrical signal with a microphone. A microphone transforms a sound wave into an electrical signal with the same complex pattern of oscillation. In digital systems, such as CDs and computers, a sensitive circuit called an analog-to-digital converter (ADC) measures the amplitude of the electrical signal 44,100 times per second. The numbers are scaled and graphed to make the waveform display. The same string of numbers is recorded as data on a CD or as compressed data in other digital formats, such as MP3. 
 |
 In recording CD-quality sound, the voltage from the microphone is measured, or sampled, 44,100 times per second. A high-quality 16 bit recorder assigns a number between 0 and 65,536 (216) with 0 being no signal and 65,536 being the maximum amplitude. Each second of stereo CD-quality sound contains 2 × 44,100 Hz or 88,200 numbers. To play a digitally recorded sound, the string of numbers is read by a laser and converted into electrical signals by a second circuit called a digital-to-analog converter. This circuit reverses the process by which the signal was converted from voltage to numbers by converting the string of numbers back into an electrical voltage. The electrical voltage is amplified until it is powerful enough to move the coil in a speaker and reproduce the sound.
|
The musical note G# has a frequency of 417 Hz and the note A has a frequency of 440 Hz. If the two notes were graphed on the same waveform graph, how would the two curves differ? - The A curve would be taller.
- The A curve would be shorter.
- The crests of the A curve would be closer together.
- The crests of the A curve would be farther apart.
 |
The answer is c. Because A has a higher frequency than G-sharp (440 Hz > 417 Hz), the crests of its graph would be closer together. 
|
| |
|

