|
How does sound carry information? Think about reading one word of a story. You recognize the word, but it does not tell you much about the story. When you read the whole story you put all the words together to get the meaning. The brain does a similar thing with different frequencies of sound. A single frequency by itself does not have much meaning. The meaning comes from patterns of changing amplitude in many frequencies together. 
|

|
When we hear, the nerves in the ear respond separately to each different frequency. The brain interprets the signals from the ear and creates a response to the individual frequencies contained in the sound wave. You hear the individual frequencies, which you can demonstrate by listening to multiple frequencies together. 
|
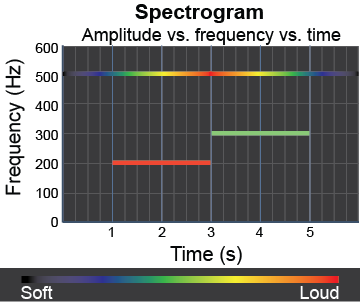
 A spectrogram is a visual representation of sound that includes frequency, loudness, and time. The vertical axis represents frequency and the horizontal axis represents time. Color is usually used to represent loudness. The brighter the color, the higher the amplitude at that frequency. The example on the right shows a sequence of sounds from 200 to 500 Hz over a period of 10 s:
 - a loud sound at 200 Hz that lasts from 1 to 3 s;
- a softer sound at 300 Hz that lasts from 3 to 5 s; and
- a sound at 500 Hz that starts soft, gets loudest at 3 s, and gets softer again.

|
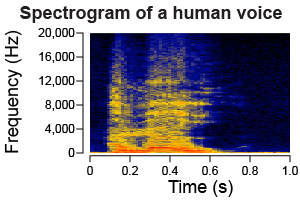
 Fundamentally, information is encoded in patterns that are decoded by the ear and brain. In writing, the patterns are sequences of letters and spaces. In sound, the patterns are the changes in amplitude for about 15,000 different frequencies. The spectrogram to the right is for a male voice saying, “Hello.” The word lasts from 0.1 s to about 0.6 s. You can see lots of sound below 1,500 Hz and two bands of sound between 2,000 and 4,000 Hz. Every person’s spectrogram is different, even when they are saying the same word. You might infer that the chart represents an adult female voice if the frequencies were somewhat higher than those of a man.
 |
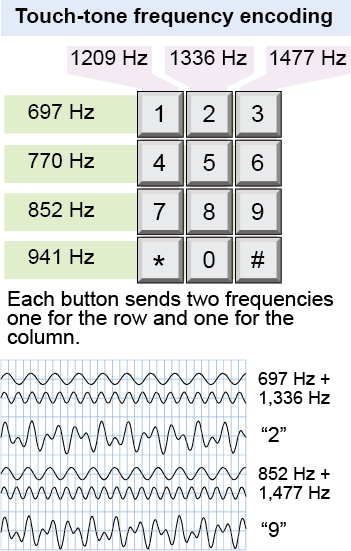
 A good example of information encoding in sound is the touch-tone sound you hear when you press a key on a phone. When this technology was developed, dialing a number into the phone generated a different sound for each key on the keypad. Each sound included two frequencies, one for the row and another for the column. With this scheme, 12 keys could be encoded with only 7 different frequencies. The electronic telephone switching system decoded the sounds to determine which number was dialed. The diagram shows the encoding for the numbers “2” and “9” along with the wave form. Touch-tone dialing is no longer used to transmit phone numbers, but you still hear the same sounds when you dial a modern digital phone. Digital phones generate the same sounds because people have gotten used to them and would think their phones were malfunctioning if they did not hear the familiar beep-beep of touch-tones!
See whether you can decode the touch-tone signal in the audio recording attached to this paragraph. There will be five short beeps then the touch-tone signal. What number does the touch-tone signal represent? You will need to use the spectrogram to solve this problem as the touch-tone numbers are encoded in 200 ms pulses. 

|
For which of the following would a spectrogram be able to represent different parts of sound? - speech
- music
- bird songs
- all of the above
 |
All of the above is correct. A spectrogram is useful for representing any sound or sounds that may have changing frequency and loudness over time. 
|

