|
Sound waves are invisible. Sensors and electronic devices are useful for displaying how the pressure of a sound wave varies with time on a waveform graph. Ordinary sound contains many simultaneous frequencies. The frequency spectrum shows amplitude versus frequency. The information content in sound is encoded in the patterns of how amplitude changes over time across many frequencies. 
|
|
microphone, frequency spectrum, Fourier’s theorem, spectrogram
|
Review problems and questions |
|

- One of the three graphs shows a sound that contains two different frequencies.
- Which graph is it and how do you know?
- What is the lower frequency in this sound?
- What is the higher frequency in the sound?

 |
- It is graph C, since the signal is not a simple sine wave.
- The lowest frequency is about 40 Hz since there are four complete cycles of the slow varying signal in 0.10 s.
- The highest frequency is around 80 Hz, since it appears to have two periods for every one period of the lower frequency (or eight complete cycles in 0.10 s).

|

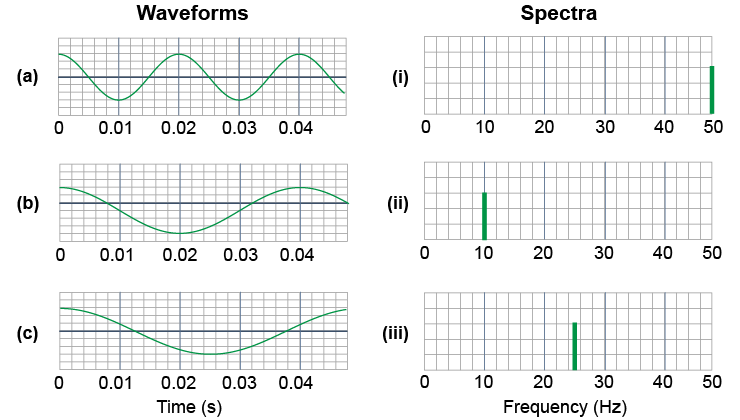
- Match each waveform from the left-hand column with one spectrum from the right-hand column. Assume that the y-axis of each graph is amplitude.


|
Waveform (a) = Spectrum (i).
Waveform (b) = Spectrum (iii).
Waveform (c) = Spectrum (ii).
The period of each wave is the time interval for one complete cycle (from maximum to minimum amplitude and back again). The frequency is the reciprocal of the period. As an example, the period of Waveform (b) is 0.04 s, and therefore the frequency is (1/0.4) Hz, or 25 Hz. 
|
- Music can be recorded, transmitted, and stored digitally. Describe the tradeoffs between sound quality and file size in digital audio formats.

|
High-fidelity CD-quality sound reproduction requires large file sizes and high transmission rates. Compressing the data (as with MP3 files) or limiting the frequency range (as with telephone signals) reduces the bandwidth requirements and memory demands, but results in lower-quality sound. 
|
Take a Quiz |

