|
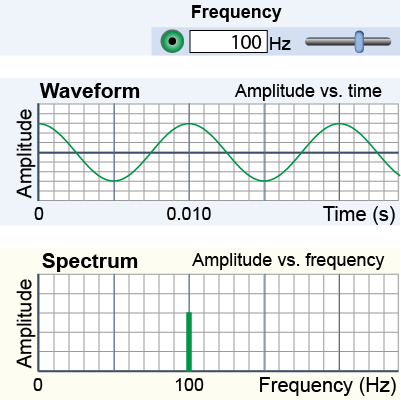
 A single, pure frequency has the form of a sine wave. Every successive cycle of a sine wave is exactly the same as the last cycle. On a waveform graph a sine wave has uniform oscillations. On a frequency spectrum, a sine wave shows up as a single peak, like a bar graph. The diagram shows a 100 Hz sine wave with an amplitude of three units on both graphs. From the waveform, one cycle takes 0.01 s, so the frequency is 1 ÷ 0.01 s = 100 Hz. The frequency spectrum shows amplitude versus frequency. The same 100 Hz wave appears as a single bar at 100 Hz with an amplitude of three.
|
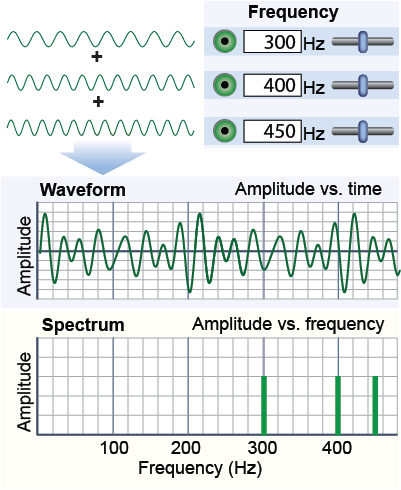
When more than one frequency is present, the wave oscillates in a more complicated pattern. The diagram on the right shows the addition of a 300 Hz wave, a 400 Hz wave, and a 450 Hz wave of the same amplitude. The resulting waveform does not have a simple repeating cycle like a sine wave, and therefore you know it contains more than one frequency. 
| 
|
The spectrum has much more information because it tells you immediately that the complicated waveform is the addition of three sine waves. The three peaks are at 300, 400, and 450 Hz, and they have equal amplitude. The frequency spectrum breaks a complex wave down into its component frequencies and shows you the relative amplitude of each. 
|
Accurate reproduction of sound in the frequency range of 20 to 20,000 Hz requires an enormous amount of data. One second of stereo, CD-quality sound includes 88,200 16-bit numbers or 1.41 million bits, corresponding to a data rate of 1.41 million bits per second (bps). Most sound is recorded, transmitted, or stored at lower data rates, but this is a tradeoff between file size and sound quality. For example, human speech includes mainly frequencies from 200 to 2,000 Hz. Telephones sound “tinny” because only this limited frequency range is included in a telephone signal. Digital audio files, such as the MP3 format, use compression algorithms to process digitally recorded sound to reduce the amount of data required per second. A standard MP3 file transmits only 128,000 bps, a compression of about 11:1 compared to CD-quality sound. 
|
If a waveform graph is not a sine wave, how many different frequencies does it contain? - None; it must contain only waves of identical frequencies.
- two
- at least two
- three
 |
The correct answer is c. Waveform graphs that are not sine waves are produced whenever two or more different frequencies are combined. 
|
| |
|

