| | Essential questions | | How do we create specific frequencies of sound, such as in music? | |
|
A guitar string vibrates at its natural frequencies. Other objects, such as wine glasses and tuning forks, also vibrate at their natural frequencies. The frequencies are controlled by properties such as size, mass, and tension. 
|
Part 1: Measuring the natural frequency

- Open the Physics of Sound application and choose the “Spectrum” option.
- Strike a tuning fork with a rubber mallet and hold it next to the microphone. Using the application, confirm that its natural frequency matches the marked value.
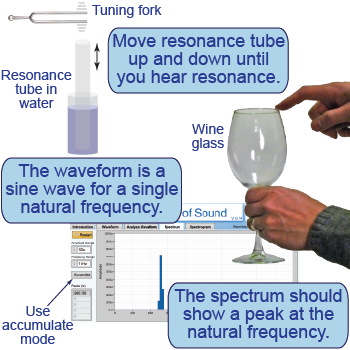
- Strike the tuning fork again and hold it over the resonance tube, partially immersed in water.
- Raise and lower the tube until you hear the loudest amplification of the tuning fork note. Measure and record the height of the tube above the waterline. Repeat for two other tuning forks.
- Firmly hold the stem of the wine glass while running a wet finger lightly around its rim. The glass should ring in a clear tone. Measure its natural frequency.
- Add water to the glass in small increments and repeat the measurements.
- Why did the tube resonate at a particular position? What characteristics of a resonance tube determine its natural frequency?
- Calculate the wavelength and then the product of wavelength and frequency for each tuning fork.
- Does the product of wavelength and frequency vary among tuning forks. Why or why not?
- Propose a hypothesis that explains the variation in resonance frequency with the height of water in the wine glass. How is your hypothesis supported by your observations?

Part 2: Controlling the natural frequency through resonance

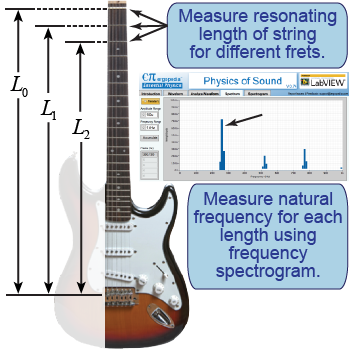
- Measure the length of string for your instrument at each of its different frets, or fingerboard positions.
- Use the “Spectrum” window to determine the natural frequency for each different string length.
- Repeat the procedure for at least two additional strings.
- Graph frequency versus length of a single string. Explain why the graph has the shape that it does.
- On the same graph, plot frequency versus length for a different string. Explain the difference between the two curves using Newton’s laws.
- Explain how resonance controls which frequencies persist in a vibrating system.

Piano note C
The audio attached to this paragraph plays four beeps followed by a grand piano C. 
|
Guitar note C
The audio attached to this paragraph plays four beeps followed by an electric guitar C. 
|
Cathedral bell C
The audio attached to this paragraph plays four beeps followed by a cathedral bell C. 
|
Alto sax C
The audio attached to this paragraph plays four beeps followed by an alto saxophone C. 
|
Organ C
The audio attached to this paragraph plays four beeps followed by an organ C. 
|
Orchestral strings C
The audio attached to this paragraph plays four beeps followed by an orchestral string section C. 
| | |
| |
|

