|
Acceleration is the rate at which velocity changes. Its SI unit is meter per second squared, or m/s2. Acceleration is a vector. In one-dimensional motion, acceleration can be positive or negative (as well as zero). The slope of the velocity–time (v vs. t) graph is the acceleration. The area under a velocity–time graph equals an accelerating object’s displacement. 
|
|
acceleration, quadratic
|
|
| | |
| | | |
| |
|
Review problems and questions |
|
- Two friends are each driving a car down Highway 101. During a particular 10 s interval, Jodi’s car moves at a constant 60 mph. During that same time interval, Julie’s car transitions from a speed of 20 mph to a speed of 30 mph.
- Whose car has the greater acceleration?
- Do you have to convert the given quantities into SI units in order to figure out which car has the greater acceleration?

 |
- Julie’s car has the greater acceleration during the specified time interval. She increases her speed by 10 mph. Jodi, by contrast, does not accelerate at all.
- No! Since one car has zero acceleration and the other has a positive acceleration, there is no need to convert anything to SI units. (In fact, as long as all speeds are given in the same units, you wouldn’t have to convert to SI units to compare the two car’s accelerations—even if both cars did change velocity.)

|

- The position–time graphs of three sprinters are shown here. Which sprinter best matches each of the following statements?
- “I underwent positive acceleration during the three-second interval shown.”
- “I underwent negative acceleration during the three-second interval shown.”
- “I underwent zero acceleration during the three-second interval shown.”

 |
- Marcelo underwent positive acceleration. The slope of his x vs. t graph at an early phase (say, t = 0.5 s) is shallow, implying a relatively low velocity, whereas the slope at a later phase (such as t = 2.5 s) is much steeper. His velocity has become more positive, so his acceleration is positive. (Put more simply, his x vs. t graph curves upward as you move to the right.)
- Ismail underwent negative acceleration. The slope of his x vs. t graph at an early phase (say, t = 0.5 s) is steep, implying a relatively high velocity. By contrast, the slope at a later phase (such as t = 2.5 s) is much less steep. His velocity has become less positive, so his acceleration is negative. (Put more simply, his x vs. t graph curves downward as you move to the right.)
- Dwayne underwent zero acceleration during the plotted interval. His x vs. t graph has a constant slope, and this means that he traveled at constant velocity.

|

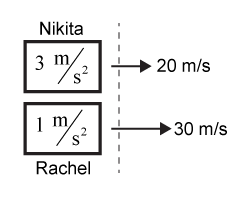
- Nikita and Rachel are driving their new cars westward on the highway. At the very same instant, they cross the Weston town line (call it t = 0). Nikita’s velocity is 20 m/s westward at that moment, while Rachel is going faster at 30 m/s (in the same direction). Each driver is accelerating westward: Nikita at 3 m/s2, and Rachel at 1 m/s2. They maintain these accelerations for 10 s (until t = 10 s).
- At what time t are Nikita and Rachel equally fast?
- At that time (when they are equally fast), who has gone farther from the town line?
- After 10 s has passed (that is, at t = 10 s ), who is farther from the town line?

 |
 Answer:
 - The two cars are going equally fast at t = 5 s after they cross the Weston town line.
- Rachel is ahead of Nikita when their speeds match.
- The two cars have traveled equal distances in the 10 s that have elapsed since crossing the town line.
Solution: These problems can be solved either by using graphs or by using algebra. One excellent approach is first to prepare the graphs and then calculate the answers with the help of the correct formulas (relationships). The graphs can then be used to check your calculations.
Part a: We are asked when Nikita and Rachel will find themselves traveling at the same velocity. The question makes sense, even though Rachel starts out faster than Nikita. How so? Because Nikita has a greater acceleration.
Asked: Time at which vN = vR
Given: Nikita’s initial velocity v0, N = 20 m/s; Rachel’s initial velocity v0, R = 30 m/s; Nikita’s acceleration aN = +3 m/s2; Rachel’s acceleration aR = +1 m/s2
Relationships: vN = v0, N + aNt; vR = v0, R + aRt
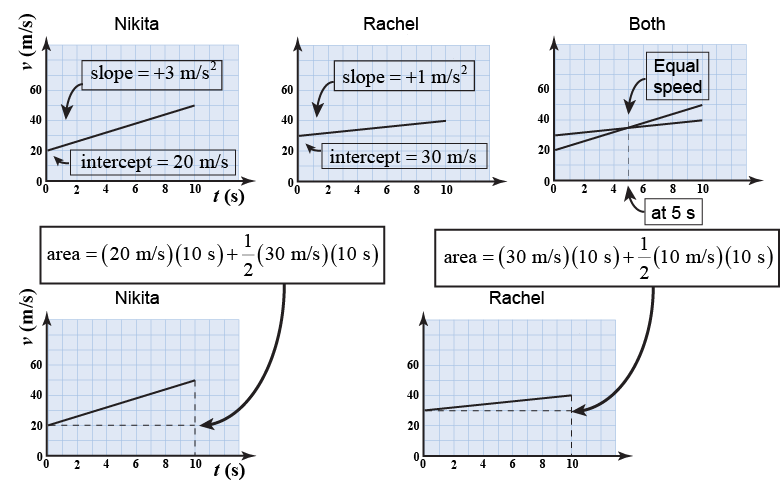
Solution: Note that we are looking for one time t at which the two velocities are equal. This means that we should equate the two velocity formulas, insert the givens, and solve for t: Since all the quantities are in SI units, let’s omit labels for clarity, then solve for t: The two cars are going equally fast at t = 5 s after they cross the Weston town line. Graphically, this can be seen from the top line of the figure. Each driver’s velocity–time graph is constructed by using her initial velocity as the intercept and the acceleration as the slope. The time of equal speed is where the lines intersect.
Part b: The distance each car has driven from the town line equals the displacement, since all of the motion is in one direction. The displacement can be obtained graphically or by using algebra. Graphically, it is the area between the x-axis and the velocity–time curve. Algebraically, it is given by the relationships listed below.
Asked: Distance traveled by each car between t = 0 and t = 5 seconds.
Given: Nikita’s initial velocity v0, N = 20 m/s; Nikita’s acceleration, aN = +3 m/s2; Rachel’s initial velocity v0, R = 30 m/s; Rachel’s acceleration aR = +1 m/s2; Elapsed time t = 5 s
Relationship: d = v0t + ½(at2)
Solution: In this case, we calculate each driver’s displacement separately: Five seconds after crossing the town line, Nikita has traveled 137.5 m, whereas Rachel has gone 162.5 m. Rachel therefore is ahead of Nikita when their speeds match.
Part c: Again we are asked how far each car has gone since time t = 0. We use the same givens and relationships as in Part b, except for the elapsed time (10 instead of 5 s): The two cars have traveled equal distances in the 10 s that have elapsed since crossing the town line. They are side by side once more. Compare Nikita’s calculation with her graph (in the lower-left corner of the illustration). Note that the first term (200 m) equals the area of the dashed rectangle, whereas the second term (150 m) equals the area of the triangle. Similarly, 300 m equals the area of Rachel’s dashed rectangle (in the lower-right graph), and 50 m equals the area of the thin triangle above it. 
|
Take a Quiz |
| |
|

