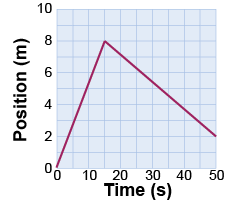
- Answer the following questions based on the position versus time graph above.
- What is the average velocity over the whole 50 s interval shown?
- What is the maximum speed shown on the graph?
- What is the total distance traveled between t = 0 and t = 50 s?
- What is the final position at t = 50 s?
- How does the acceleration at t = 10 s compare with the acceleration at t = 30 s?
- A car traveling at 15 m/s in a straight line accelerates for 5 s with an acceleration of 2 m/s2. What is its final velocity?
- How long should Pete’s approach to his long jump attempt be if he wants to be at a speed of 9 m/s and can accelerate at 4 m/s2?
- Rachel is walking at 3 m/s when she walks into a glass door and stops in 0.05 s. What is her acceleration?
 A zebra is at rest 60 m away from a charging lion running at 17 m/s. If the zebra accelerates at 2 m/s2, will the lion catch it? A zebra is at rest 60 m away from a charging lion running at 17 m/s. If the zebra accelerates at 2 m/s2, will the lion catch it?
- A submarine begins ascending to the surface of the ocean. It experiences an overall acceleration of 1.7 m/s2 for the first 5 s. What is its velocity after 3.2 s?
 What is the average acceleration of a cheetah that starts at rest and 3 s later is moving at a speed of 27 m/s? Is the acceleration greater or less than the acceleration of a $100,000 sports car that can go from 0 to 60 mph in 4 s? What is the average acceleration of a cheetah that starts at rest and 3 s later is moving at a speed of 27 m/s? Is the acceleration greater or less than the acceleration of a $100,000 sports car that can go from 0 to 60 mph in 4 s?
 Jane is riding her bicycle at 10 m/s when she begins to decelerate at 1.5 m/s2. Jane is riding her bicycle at 10 m/s when she begins to decelerate at 1.5 m/s2.
- How long will it take Jane to stop?
- How far will she have traveled in this time?
| | - At her most recent track race, Stella had an acceleration of 2.1 m/s2 during the first 3 s of the race. What was her velocity after 2 s?
 A speeding car traveling at 35 m/s passes a stationary police car. At the moment the car passes, the police car starts accelerating in the same direction with an acceleration of 3 m/s2. A speeding car traveling at 35 m/s passes a stationary police car. At the moment the car passes, the police car starts accelerating in the same direction with an acceleration of 3 m/s2.
- How long does it take the police car to catch up with the speeder?
- What is the speed of the police car at the moment it catches up with the speeder?
- How far have both cars traveled when the police car catches up?
- Convert both car’s speeds to miles per hour. Is it likely the police car would actually catch the speeder? Explain your reasoning.
 A motorcycle has a maximum acceleration of 3 m/s2 in either direction and a maximum speed of 25 m/s. How long does it take for the motorcycle to reach someone who is 1 km away? A motorcycle has a maximum acceleration of 3 m/s2 in either direction and a maximum speed of 25 m/s. How long does it take for the motorcycle to reach someone who is 1 km away?
 A car travels 100 m while decelerating to 8 m/s in 5 s. What was its initial speed? What is the magnitude of the acceleration? A car travels 100 m while decelerating to 8 m/s in 5 s. What was its initial speed? What is the magnitude of the acceleration?

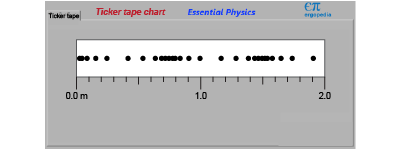
 When operated in “ticker tape” chart mode, moving the ErgoBot by hand will generate a chart with a dot plotted every 0.1 s. When operated in “ticker tape” chart mode, moving the ErgoBot by hand will generate a chart with a dot plotted every 0.1 s.
- In the ticker tape chart above, where does the ErgoBot have positive acceleration?
- Where does it have negative acceleration?
- Explain what features in the chart you interpret as positive and negative acceleration.
- If the dots were spaced widely apart in the chart, then what could you infer about the speed of the ErgoBot?
 Linda is out jogging at a constant speed of 3 m/s. She jogs past Maggie, who is stationary but immediately takes off on her bicycle to try and catch up to Linda. Maggie accelerates on her bicycle at 2 m/s2. How long does it take Maggie to catch Linda? Linda is out jogging at a constant speed of 3 m/s. She jogs past Maggie, who is stationary but immediately takes off on her bicycle to try and catch up to Linda. Maggie accelerates on her bicycle at 2 m/s2. How long does it take Maggie to catch Linda?
 Vinny is on a motorcycle at rest, 200 m away from a ramp that jumps over a gully. Calculate the minimum constant acceleration Vinny must have to get to the ramp in 8 s before his pursuers catch up with him. Vinny is on a motorcycle at rest, 200 m away from a ramp that jumps over a gully. Calculate the minimum constant acceleration Vinny must have to get to the ramp in 8 s before his pursuers catch up with him.
|

