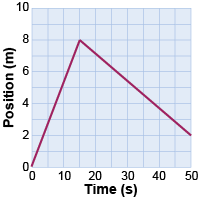
 For the following questions, refer to the position versus time graph above. For the following questions, refer to the position versus time graph above.
- What is the average velocity from 30 to 40 s?
- What is the distance the object travels between 0 and 50 s? What is the ball’s change in position?
- What is the object’s velocity at t = 5 s?
 Calculate the conversion factor between miles per hour and meters per second. Calculate the conversion factor between miles per hour and meters per second.
 Marie is driving from the USA into Canada. She notices that all of the Canadian speed limit signs are in kilometers per hour; her odometer only displays miles per hour. How many kilometers per hour is she driving when the odometer reads 19 miles per hour? Marie is driving from the USA into Canada. She notices that all of the Canadian speed limit signs are in kilometers per hour; her odometer only displays miles per hour. How many kilometers per hour is she driving when the odometer reads 19 miles per hour?
 Miguel solves a physics problem involving a car moving on the highway; the final velocity of the car in his answer is 3.2 m/s. Wanting to have an intuitive feel for his answer, he decides to convert to miles per hour. Calculate the velocity of the car in miles per hour. Miguel solves a physics problem involving a car moving on the highway; the final velocity of the car in his answer is 3.2 m/s. Wanting to have an intuitive feel for his answer, he decides to convert to miles per hour. Calculate the velocity of the car in miles per hour.

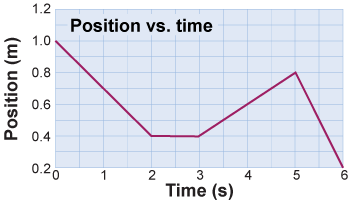
 The graph shows the position of a robot car moving along a straight track for 6 s. Use the graph to answer the following questions. The graph shows the position of a robot car moving along a straight track for 6 s. Use the graph to answer the following questions.
- What is the car’s speed 1 s after it starts?
- What is the maximum speed reached by the car?
- When does the car reach its maximum speed?
- What is the total distance the car travels between
t = 0 and t = 6 s? - What is the car’s maximum positive velocity?
| |  At the point when the race clock says 5:15.00 (315 s) one car is 500 m behind the starting line. By the time the clock reaches 5:56 (356 s) the car is 800 m in front of the starting line. What is the car’s average velocity during this time? Assume the car moves in a straight line at constant speed in the positive direction. At the point when the race clock says 5:15.00 (315 s) one car is 500 m behind the starting line. By the time the clock reaches 5:56 (356 s) the car is 800 m in front of the starting line. What is the car’s average velocity during this time? Assume the car moves in a straight line at constant speed in the positive direction.
 Mitch wants to sketch a position versus time graph for a recent trip he took to New York City. During the trip, Mitch drove for one and one half hours at 60 miles/hr, stopped for one hour, and then drove at 50 miles/hr for the remaining two hours. Mitch stayed in town for three hours. Being in a rush on his way back, he drove at 95 miles/hr without stopping. Draw a position versus time graph of Mitch’s trip. Mitch wants to sketch a position versus time graph for a recent trip he took to New York City. During the trip, Mitch drove for one and one half hours at 60 miles/hr, stopped for one hour, and then drove at 50 miles/hr for the remaining two hours. Mitch stayed in town for three hours. Being in a rush on his way back, he drove at 95 miles/hr without stopping. Draw a position versus time graph of Mitch’s trip.

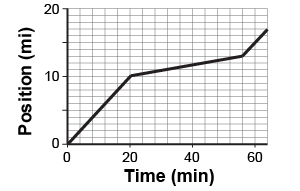
 The figure shows a position versus time graph of Sylvia’s trip to work. The figure shows a position versus time graph of Sylvia’s trip to work.
- What is Sylvia’s instantaneous velocity 12 min into the trip?
- What is it 36 min into the trip?
- What is it 60 min into the trip?
 Which equation is the best match to the following sentence? Which equation is the best match to the following sentence?
“The initial position is the final position minus the product of velocity multiplied by time.” - xf = xi + vt
- xi = xf − vt
- vt = xf − xi
- v = (xf − xi) ÷ t

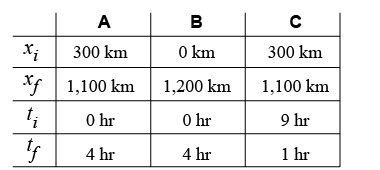
 A train travels along a 1,200 km track. At 9:00 am the train’s position is 300 km from the eastern end of the track. At 1:00 pm the train’s position is 1,100 km from the eastern end of the track. Which of the columns in the table above (A, B, or C) represents the best choices for the values of the variables needed to solve this problem? A train travels along a 1,200 km track. At 9:00 am the train’s position is 300 km from the eastern end of the track. At 1:00 pm the train’s position is 1,100 km from the eastern end of the track. Which of the columns in the table above (A, B, or C) represents the best choices for the values of the variables needed to solve this problem?
|

