|
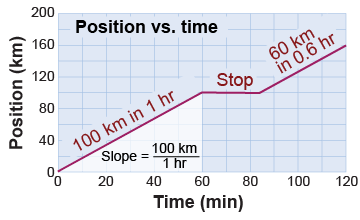
A graph is a useful way to show motion in which velocity changes over time. Consider a trip between Houston and College Station, Texas, which are about 160 km (98 mi) apart. You drive at 100 km/hr (62 mph) for 1 hr, take a 24 min rest, then drive for another 36 min at the same speed. You travel 160 km over the course of 2 hr, so your average speed is 160 km ÷ 2 hr = 80 km/hr. Your car’s speedometer, however, showed that you were driving at 100 km/hr. Did you drive at a speed of 100 km/hr or 80 km/hr? 
|
 The position versus time (or x vs. t) graph is a graphical model to represent motion. This model’s graph shows position x on the vertical axis and time t on the horizontal axis. The origin is Houston and in the first hour your position changed from zero to 100 km. For the next 24 min the graph is flat—you were stopped. The final 36 min shows the last 60 km of movement.
|
The slope of a line is the ratio of rise over run, or change along the vertical axis divided by change along the horizontal axis. The velocity is the slope of the line on a position versus time graph. On the x versus t graph, staying at rest creates a flat line with a slope of zero. In the example, over the first hour the change in position is 100 km and the change in time is 1 hr, giving a velocity (slope) of 100 km/hr. 
|

 |
Notice the similarity between the definition of slope you find in a math book and the formula for calculating speed from a position versus time graph. Both are the ratio of the change along the vertical axis divided by the change along the horizontal axis. To determine the speed from the position versus time graph you would use the “physics” equation. Keep in mind that ti, the initial time, is often taken to be zero; in such cases, ti is not written and the final time tf may be replaced with t. 
|
Suppose you turn around in College Station and head right back. The position versus time graph (below) shows the return trip as the downward sloping line starting at t = 120 min. The negative slope here shows travel in the negative direction, toward the origin. A positive slope for the first part of the trip meant travel in the positive direction, away from the origin. In both cases the velocity is the slope of the position versus time graph—but during the return trip the velocity is negative. 
|

|
Jake travels at a constant speed of 50 km/hr toward his destination 250 km away. How long does it take him to arrive? - 5 hr
- 4 hr
- 3 hr
- 2 hr
 |
The answer is a, 5 hours, because 
|

