|
Velocity is the rate of change in position over time. In the case of one-dimensional motion, velocity can be positive or negative depending on the direction of motion. Speed is the absolute value of velocity. The graphs of position vs. time and velocity versus time are useful tools for analyzing motion. The slope of the x versus t graph is the velocity. 
|
|
speed, velocity, slope, average velocity, instantaneous velocity, reference frame, inertial reference frame
|
|
| | |
| | |
| |
|
Review problems and questions |
|
- Describe in one sentence how the word speed relates to something you know. Your answer must use the word in its correct meaning for physics.

 |
Examples:
My brother’s car was moving at a speed of 55 mph yesterday.
The maximum legal speed on my street is 30 mph. 
|
- Use the word position in a sentence describing an experience you had. You must use the word so that its meaning is similar to what position means in physics.

 |
Examples:
The queen on a chess board starts at a position in the first row on the fourth square from the left.
Highway markers are placed at positions 0.1 miles apart on many roads. 
|
- The term vector is best described by which of the following?
- an arrow that represents an object’s speed
- a quantity that has a magnitude and a direction
- the change in position from one point to another

 |
The correct answer is b, a quantity that has a magnitude and a direction. Force, position, displacement, and velocity are vectors. 
|

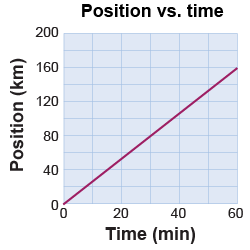
- The plot on the right shows the graph of position versus time of a vehicle. Answer the following questions:
- What is the total distance traveled by the vehicle?
- How far does the vehicle travel in the first 30 min?
- What is the average speed of the vehicle?
- What is the maximum speed of the vehicle?
- How long does it take for the vehicle to travel 20 km?

 |
Answer: - 160 km
- 80 km
- 160 km/hr
- 160 km/hr
- 7.5 min
Solution: - The car started at 0 km and never traveled backward. At the end of the journey the car is at position 160 km, so it traveled 160 km in total.
- The car traveled 80 km in 30 min.
- The average slope of the graph from the beginning to the end is (160 km − 0 km)/(60 min − 0 min)which is 2.67 km/min or 160 km/hr.
- Because the slope of the graph is constant, the car travels the same speed for the whole trip, so the maximum speed is also 2.67 km/min or 160 km/hr.
- If v = d/t, then rearranging to solve for t, we get that t = d/v, so (20 km)/(2.67 km/min) = 7.5 min.

|
- You start driving from Austin toward Houston with a constant speed of 120 km/hr (75 mph). After 1.5 hr you stop for 0.5 hr. Then you continue driving with a new constant speed v2 and reach Houston 45 min later.
- If the total distance from Austin to Houston is 265 km, what is the speed v2?
- What was your average speed during the trip?

 |
- After the first part of the journey, you have traveled for (120 km/hr) × (1.5 hr) = 180 km. This means that you have 265 km − 180 km = 85 km to go. If you cover that distance in 45 min or 0.75 hr, then you travel at a speed of (85 km)/(0.75 hr) = 113 km/hr.
- In total, you are on the road for 1.5 hr + 0.5 hr + 0.75 hr = 2.75 hr. If you have traveled a total distance of 265 km over that time, then your average speed is (245 km)/(2.75 hr) = 89 km/hr.

|
Take a Quiz |

