| | Essential questions | | What do graphs of motion look like? | |
|
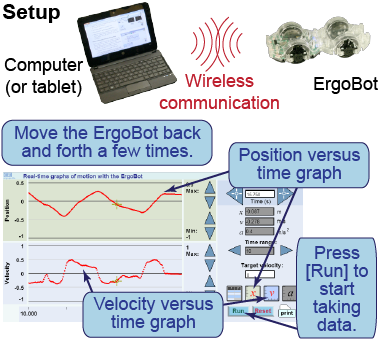
The ErgoBot is a robotic device that displays its motion—distance, speed, and acceleration—on your computer in real time while you move it! Look for the connection between the forces you apply to push the ErgoBot and how the ErgoBot’s distance and speed change. 
|
Part 1: Testing the ErgoBot to see graphs of its motion

- Pair your computer (or tablet) to your ErgoBot using your computer’s Bluetooth™ utility.
- Launch the application [below] on your computer.
- Click the [v] (“velocity”) button so you can see both position–time and velocity–time graphs.
- Press [Run] to upload instructions to the ErgoBot and wait for it to beep to signal it is “ready.”
- Move the ErgoBot back and forth on the floor.
- Watch how the position and velocity graphs of the ErgoBot change as you move it.
- What is the minimum (nonzero) velocity the ErgoBot can detect?
- If you push the ErgoBot across the floor and let go, what happens to its velocity? What causes it?
- Try to move the ErgoBot across the floor with a
constant velocity. What is the shape of the position versus time graph for a constant velocity? 
Use the ErgoBot to investigate position and velocity! Pair your computer with your particular ErgoBot device in one of two ways: - by using your computer’s Bluetooth™ utility to pair and connect the ErgoBot device to your computer; or
- by plugging the ErgoDAQ into your computer’s USB port and then pairing and connecting to the ErgoBot device.
Once you have succeeded in pairing devices, press the “iPhysics” button [at left]—the “iPhysics” buttons in this e-Book tell you it is a simulation or other e-resource—to launch an interactive tool to collect data from the ErgoBot.
Click on the following links for a PDF with more detailed instructions for how to pair your computer with the ErgoBot.
|
Part 2: How do the ErgoBot’s wheels measure their motion?

- Launch the “testing” application on your computer.
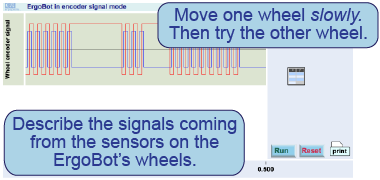
- Using your hand, move one ErgoBot wheel at a time and watch the display.
- Roll the ErgoBot across the floor. Watch the display.
- Sketch the graph as each wheel moves.
- How does the graph change when the ErgoBot moves slowly? How about when moving quickly?
- Based on the graph, describe how you think the sensors on the ErgoBot’s wheels work.

|
In this interactive element, you can view the output from the encoders on the ErgoBot’s wheels. Launch the application, press [Run], and then use your hand to move the ErgoBot.
|
Part 3: Ticker tape chart mode

- Launch the “ticker tape chart” application on your computer.
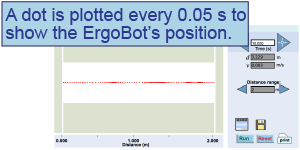
- Move the ErgoBot in one direction, speeding it up and slowing it down a few times, to create a chart (at right).
- Where is the ErgoBot moving the fastest? The slowest? What chart property indicates how fast the ErgoBot is moving?
- If a ticker tape chart shows dots spaced increasingly close together, what can you infer about the object’s motion?

|
|
Use this interactive tool to observe the motion of the ErgoBot in “ticker tape chart” mode. A dot is plotted every 0.05 s showing the position of the ErgoBot. Move the ErgoBot faster and slower and observe how the chart changes.
| | |
| |
|

