|
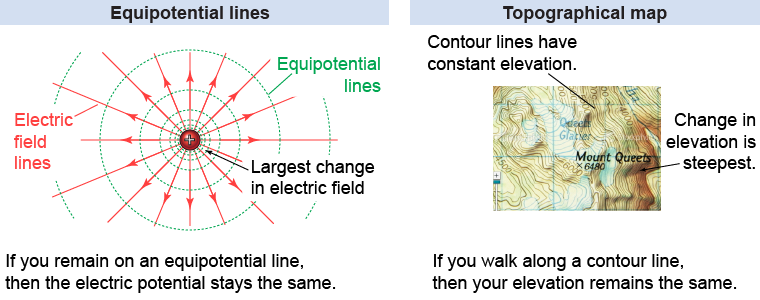
The most useful visual representation of the electric potential is formed by mapping lines of constant electric potential called equipotential lines. For a point charge, the electric potential decreases as 1/r from equation (18.5), so the equipotential lines are concentric circles, as shown in the illustration below. Notice that, while the electric field direction may vary around the point charge, the electric field always points perpendicular to the equipotential lines. 
|

|
In a topographical map, the location where the contour lines are most “bunched up” is where the elevation is changing most rapidly. In a similar way, the density of equipotential lines indicates how rapidly the electric field is changing at that location. In the illustration above, the electric field is changing most rapidly near to the electric charge, as is indicated by how the electric potential lines bunch up there the most. 
|
The electric field is zero everywhere inside a conductor, as you learned earlier on page 529. If the electric field is the same (zero!) everywhere inside a conductor, then all of the conductor is at the same potential—i.e., it is an equipotential. This is a general property of conductors in equilibrium, that they have the same electric potential everywhere inside. 
|
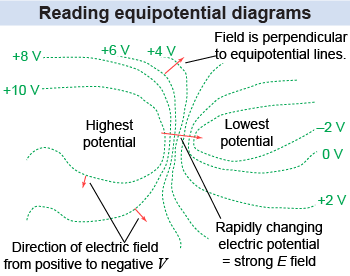
 If you are given a diagram with equipotential lines, you can infer the properties of the electric potential and electric field using some simple rules:
 - The direction of the electric field is always perpendicular to equipotential lines,
- Electric field lines point from positive to negative electric potential,
- Locations where equipotential lines are “bunched up” correspond to a strong electric field.

|
| |
|

